En atención a la creciente preocupación sobre la confianza en...
Leer más
Modeling takes a whole new twist with omicron
ince shortly after COVID-19 started popping up in the U.S., Mayo Clinic’s Predictive Analytics Task Force has been tracking it. A collaboration between Mayo Clinic Quality and the Mayo Clinic Robert D. and Patricia E. Kern Center for the Science of Health Care Delivery, the task force’s primary responsibility is to build and maintain a predictive model for COVID-19 hospitalizations across Mayo.

“Originally the ask was to be able to help the institutional leaders to plan for how many patients were going to be hospitalized with COVID-19 across the enterprise,” says Shannon Dunlay, M.D., associate medical director for the Mayo Clinic Kern Center for the Science of Health Care Delivery, and one of the task force leads.
“We evaluated existing models back at the beginning of 2020 and felt they didn’t meet our needs exactly,” she says. “Dr. Curt Storlie and his team led the effort to build the Mayo model.”
There are others involved from Quantitative Health Sciences and the Center for Digital Health as well, but Curt Storlie, Ph.D., is the lynch pin, says Dr. Dunlay.

“Curt is really the one who developed this model — he and his team — and we’re very grateful for all the hard work that he does,” she says. “He’s worked every day on this practically since the start of the pandemic, and I know that Mayo Clinic leaders are thankful for this.”
The model is a computer program, or algorithm, that takes in publicly available data from the state health departments and population mobility and proximity data, as well as internal Mayo data for testing, hospitalizations and staff absences.
“Early on we were able to build the model with what we were learning about the virus, what scientists were reporting around the world,” says Dr. Storlie. “We use a Bayesian model — a statistical model that allows us to probabilistically account for uncertainty regarding inputs, and outputs.”
Mayo’s model was able to learn from the observed spread and effects of the virus, and by the time the delta variant came on the scene, the scientists were assured of its predictive capabilities.

“We had been working with the model for COVID a long enough time that everybody felt confident,” says Katherine Noe, M.D., Ph.D., a neurologist at Mayo Clinic in Arizona, and vice chair of the task force. “It had a proven track record and we also felt very comfortable with the facts about the way the virus behaves.” Dr. Noe is also the physician lead for Quality at Mayo Clinic in Arizona.
In addition to predicting the number of patients with COVID-19 Mayo Clinic staff will need to care for at each of its hospitals, the model is able to predict staffing absences for each region. This allows clinic leaders to make informed, albeit difficult, decisions regarding each location’s ability to offer regular surgical and other non-emergency care.

The Mayo Clinic model now can predict cases and hospitalizations in every state in the U.S. In Minnesota in particular, state leaders have taken advantage of that capability, and the team sends regular reports to the governor’s office containing predictions for cases and hospitalizations for the state, and each individual county.
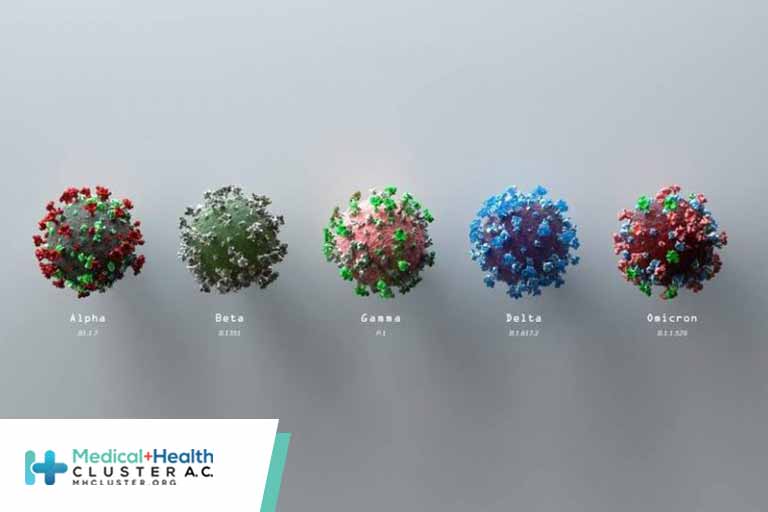
And then omicron started cropping up around the world, and the team could see this was going to be different.
“Suddenly we had to relook at every single one of those assumptions,” says Dr. Noe. “‘How fast does it spread? How effective is the vaccine? How prevalent is it in our communities? Do the vaccines work?'”
Every single question they needed to answer and all those facts they had learned over two years needed to be revisited and revised. And sometimes revised several times.
“We knew from what we saw in South Africa and the U.K., that omicron was going to be an abrupt and different experience from the gradual changes the model was able to accommodate previously,” says Dr. Storlie.
“First we watched the model evolve on its own. Then when the differences became clear, when we could see enough data to address the seeming randomness, we were able to input more accurate information,” he says.

The omicron variant of COVID-19 spread much more quickly than previous versions but was not causing nearly as many hospitalizations. Dr. Storlie and his team had to go into the model and adjust the variables based on Mayo’s more nuanced observations, compared to some of the publicly collected and calculated information that was previously being fed into it.
In part because of the lingering presence of the delta variant and also because of the different disease profile brought by omicron, the team found their prediction capabilities were limited for the first few weeks of Dec. 2021.
“It was very difficult to get data, impossible really, to get reliable data on the prevalence of omicron for local regions,” says Dr. Storlie. “Just before the holidays we were able to leverage the data from New York and Miami to start getting more precise estimates about when and what would happen here — in Minnesota — and across our other campuses.”
And their predictions stayed on target. By taking a more critical approach to emerging omicron information, the team didn’t need to revise their estimates substantially when other agencies recognized they had miscalculated.
“We try to be very transparent with Mayo Clinic leadership about the uncertainty of the variables, and ‘what we know’,” says Dr. Noe. “Two to four weeks of accurate warning is about the best we can do, and especially with omicron — literally the situation was changing day by day.”
“The more we can see into the future, the better we’re able to help the practice as they make these very difficult decisions,” she continues.
Dr. Storlie and his team will continue to plug in the numbers and refine the reports as omicron makes the rounds. He thinks the next few weeks or so is going to be pretty rough as we work our way through the peak of new infections. However, then the situation should improve dramatically.

“The thing we have going for us in the U.S. is that as a society, in a month or two, we will have by far the most robust immunity to this virus that we’ve ever had,” he says.
At that point, a large majority of the population will have been vaccinated, recovered from COVID-19 infection, or exposed to omicron and their immune system successfully fought off the virus, he says.
Then he sees the next hurdle as waning immunity, which can be addressed by updating vaccines and getting on a manageable cycle for boosters. “If we proceed in this fashion, some day soon COVID-19 will be more of a nuisance like the flu,” says Dr. Storlie, “rather than the very big problem it is today.”
In the meantime, he and his fellow modelers will keep on crunching the numbers and doing their part to help keep their Mayo colleagues and patients safe and sharing what they learn with public health proponents and health care providers around the world.
Dr. Storlie’s team of data scientists in the Mayo Clinic Kern Center for the Science of Health Care Delivery includes several involved with the COVID-19 modeling on a day-to-day basis.
These scientists are Ricky Rojas, Ethan Heinzen, Pat W. Johnson, Gavin Schaeferle and Patrick Wilson.
Visit Mayo Clinic’s COVID-19 map to see some of the data resulting from their work.


