
En atención a la creciente preocupación sobre la confianza en...
Leer más
Compare Trends in COVID-19 Cases and Deaths in the US
Data will update as soon as they are reviewed and verified, oftentimes before 8 pm ET. However, daily updates might be delayed due to delays in reported data. On 4 February 2021, a state reported 1,507 new deaths. CDC is working with the state to assess the time period from which these data cover. This may temporarily impact death counts, rates and averages.
Data Sources, References & Notes: Data Sources, References & Notes: The case classifications for COVID-19, a nationally notifiable disease, are described in an updated interim COVID-19 position statement and case definition . issued by the Council of State and Territorial Epidemiologists on August 5, 2020 . However, there is some variation in how jurisdictions implement these case classifications. More information on how CDC collects COVID-19 case surveillance data can be found at CDC’s COVID-19 FAQ webpage.
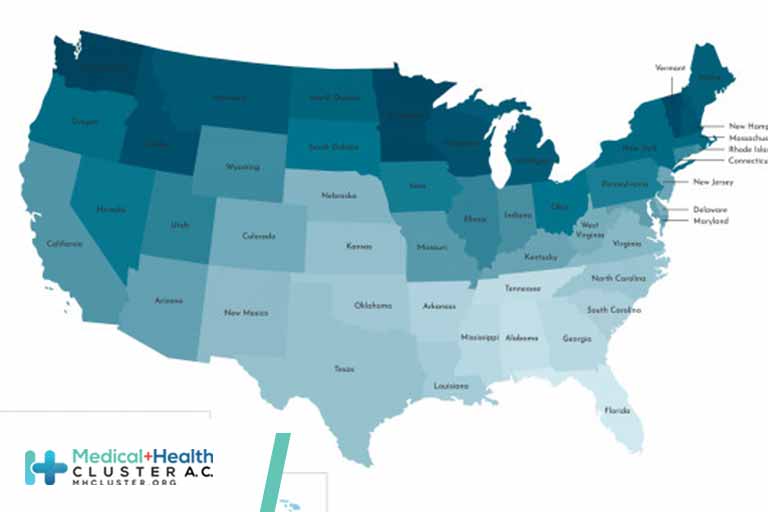
HHS Regions present an aggregate of data for the states and territories in each region as defined on the HHS website.
The figure and corresponding data table can be modified to show COVID-19 case and death trends for up to six states, territories, or HHS regions. When daily cases of COVID-19 are displayed, the index date is when 10 average daily cases were first recorded. When daily deaths attributed to COVID-19 are displayed, the index day is when 3 average daily deaths were first recorded. For both of these measures, the 7-day moving average of new cases or deaths (current day + 6 preceding days divided by 7) was calculated to smooth expected variations in daily counts since the index date.
When cumulative cases or deaths of COVID-19 are displayed, the index date is when 100 total cases or deaths were first recorded. The trend line shows the cumulative cases or deaths by number of days since the index date.
When daily case or death rates per 100,000 are displayed, the index date is when .01 average daily cases or deaths per 100,000 people was first recorded. The trend line shows the 7-day moving-average of new cases or deaths per 100,000 people using the US Census Bureau Population Estimates Program by the number of days since the index date.
When cumulative case or death rates per 100,000 are displayed, the index date is when 0.3 total cases per 100,000 people was first recorded. The trend line shows the total cases per 100,000 using the US Census Bureau Population Estimates Program by the number of days since the index date.
*2018 population estimates are still used for American Samoa, Federated States of Micronesia, Guam, New York City, Northern Mariana Islands, Palau, Republic of Marshall Islands and United States Virgin Islands.
CDC’s overall COVID-19 case numbers are validated through a confirmation process with each jurisdiction. COVID-19 case numbers reported on other websites may differ from what is posted on CDC COVID Data Tracker due to the timing of reporting and COVID Data Tracker updates, which may differ by up to 24 hours. CDC COVID-19 counts from previous dates may be continually revised as more records are received and processed. Not all jurisdictions report counts daily, some counts are reported in batches and may increase COVID-19 case and death counts at different intervals and appear as spikes. The process used for finding and confirming COVID-19 cases displayed by other sites may differ.
Total cases are based on aggregate counts of COVID-19 cases reported by state and territorial jurisdictions to the Centers for Disease Control and Prevention (CDC) since January 21, 2020, with the exception of persons repatriated to the United States from Wuhan, China, and Japan. All displayed counts include confirmed COVID-19 cases and deaths as reported by U.S. states, U.S. territories, New York City (NYC), and the District of Columbia from the previous day.
In accordance with the CSTE definition of COVID-19 cases and deaths, counts for many jurisdictions include both confirmed and probable COVID-19 cases and deaths. Counts for NYC and New York State are shown separately; data for New York State show total cases and deaths for the state excluding data for NYC. COVID-19 case and death data that are not available to CDC are denoted by N/A. For aggregate state-level data, CDC calculates the number of new cases or deaths each day either by using the information provided by states and territorial jurisdictions or by calculating the difference in cumulative counts reported by the state from the day before.
CDC also is working closely with states and jurisdictions to incorporate their incorporate their historical data. The number of historical cases and deaths presented on CDC’s website reflects the information provided by the states and jurisdictions. Thus, data may reflect either the date the case or death occurred or the date it was recorded in the state. Provision of historical cases and deaths by jurisdictions can influence new case and death numbers and 7-day averages once CDC incorporates these data and assigns the data to the appropriate dates.
Créditos: Comité científico Covid