
En atención a la creciente preocupación sobre la confianza en...
Leer más
Variant Proportions
Monitoring Variant Proportions
Variants of SARS-CoV-2, the virus that causes COVID-19, are expected to continue to emerge. Some will emerge and disappear, and others will emerge and continue to spread and may replace previous variants. For example, the variant of the virus that caused the first U.S. COVID-19 cases in January 2020 is no longer detected among variants circulating in the country.
CDC’s national SARS-CoV-2 genomic surveillance program identifies and tracks SARS-CoV-2 variants circulating in the United States and calculates the proportion of variants causing infections, nationally and by HHS region. The thousands of sequences provided every week through CDC’s national genomic surveillance efforts fuel the comprehensive and population-based U.S. surveillance system required to monitor the spread of variants.
Widespread, rapid genomic sequencing provided by the program, combined with phenotypic data, are used to determine whether COVID-19 tests, treatments, and vaccines authorized for use in the United States will work against emerging variants.
Nowcast
Nowcast is a model that projects more recent proportions of circulating variants and enables timely public health action. CDC providing weekly Nowcast estimates which will be updated every week on Tuesday.


More About Variants
Understanding Variants
- Variants of the Virus that Causes COVID-19
Genomic Surveillance
- Genomic Surveillance for SARS-CoV-2 Variants
- Substitutions of Concern for SARS-CoV-2 Monoclonal Antibody Therapies
- SARS-CoV-2 Variant Classifications and Definitions
- Published SARS-CoV-2 Sequences
- Global Variants Report
- Science Brief: Emerging SARS-CoV-2 Variants
About These Data
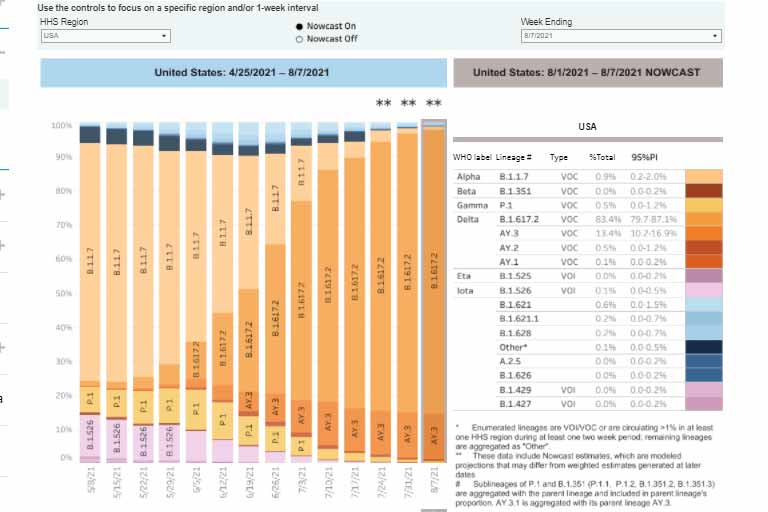
All Variants in the United States
The U.S. map shows the estimated weekly proportions of the most common SARS-CoV-2 variants circulating in the United States, divided by HHS regions. If a specific region is selected, the data will change to reflect the selected region. For example, if Region 4 is selected, data will reflect estimates based on reported results from MS, GA, AL, TN, KY, NC, SC, and FL. Data on the right of the U.S. map show the estimated variant proportions for the most common variants and all variants of interest (VOI) and variants of concern (VOC) for the selected region. Data can be filtered by timeframe (one-week periods), HHS region, and variant.
Nowcasting: The default setting for this U.S. map is to CDC’s Nowcast estimates. Because it takes 2-3 weeks from the time a sample is collected to provide estimates of emerging variant proportions, Nowcast is an important tool that can estimate proportions for more recent time intervals. Nowcast does not predict future spread of the virus, but it does help us estimate current prevalence of variants, based on genomic surveillance and other related factors like how many people live in a region. Estimates of variant proportions for previous weeks may change as more data are reported. Nowcast estimates consistently align with the weighted proportions based on reported sequencing data, which are published 2-3 weeks later.
Weighted Proportions
To provide more representative national and regional estimates, calculations account for non-random sampling of data over time and across states. For example, sequences generated from outbreak investigations are often from a very narrow geographical region (such as a school) and may skew proportions within its larger jurisdiction. Using a survey-design-based approach, CDC uses statistical weights for these estimates that are based on the number of reverse transcription polymerase chain reaction (RT-PCR) tests and number of positive RT-PCR test results received, stratified by state, specimen collection date, and by genomic surveillance data source. Genomic surveillance data sources include commercial laboratories, public health laboratories, hospital laboratories, and other testing locations. Estimates of weighted variant proportions from the most recent weeks are subject to change as some specimens from that period may still be processing after CDC updates the data. Regional proportions are based on the number of sequences from each jurisdiction in the region. Different jurisdictions may provide different numbers of specimens or sequences, and lower numbers can produce greater uncertainty in the weighted proportion estimates.
Unweighted Proportions
The unweighted proportions table shows the states, or jurisdictions, for which CDC has at least 300 sequences from specimens collected during the selected timeframe. For states and jurisdictions not listed, CDC has insufficient genomic surveillance data for the specified time interval. Variant proportions are estimates based on genomic sequences obtained through CDC and its partners and were designed to be representative of all cases during the selected timeframe. They may not match cases reported by states, territorial, tribal, and local officials. Proportions are calculated using empirical (unweighted) data, which may change over time as reporting times may differ by jurisdiction. These data will be updated every Tuesday.
Créditos: Comité científico Covid